
The Crick Institute, London, UK // 23 – 24 September 2019
Below is the summary of how the two days went. If you’d like, you can skip straight to additional materials which includes a list of recommended software, demos and example datasets and some useful publications.
Voxelwise – “The Aftermath”
Over two rainy days in late September, about 70 people from a small, but vibrant preclinical neuroimaging community got together to listen to several experts’ perspectives on neuroimaging and analysis, and to network with each other.
The event was organised by Diana Cash from The BRAIN centre (KCL), Bernard Siow from The Crick, Bill Crum from Imperial and Gary Zhang from CMIC-UCL; generously supported by grants from the Crick networking fund and CMIC, and supplemented by sponsorship from GSK, ARC and Bruker. We are pleased that the representatives from all sponsoring organisations also attended the event and participated in discussions and networking.
Some Statistics
There were 70 registered delegates, including 14 with bursaries (registration fee waived for unfunded graduate students or post-docs) and 20 invited speakers. People came from 11 countries: 2 Canada, 1 Finland, 3 France, 7 Germany, 3 Italy, 1 Netherland, 1 Norway, 3 Sweden, 1 Switzerland, 1 USA, and the majority of 47 from the UK. Of UK delegates, 33 were from London (UCL, KCL, Imperial and Crick) and the others came from Cambridge, Cardiff, Edinburgh, Glasgow, Liverpool,
Nottingham and Oxford.
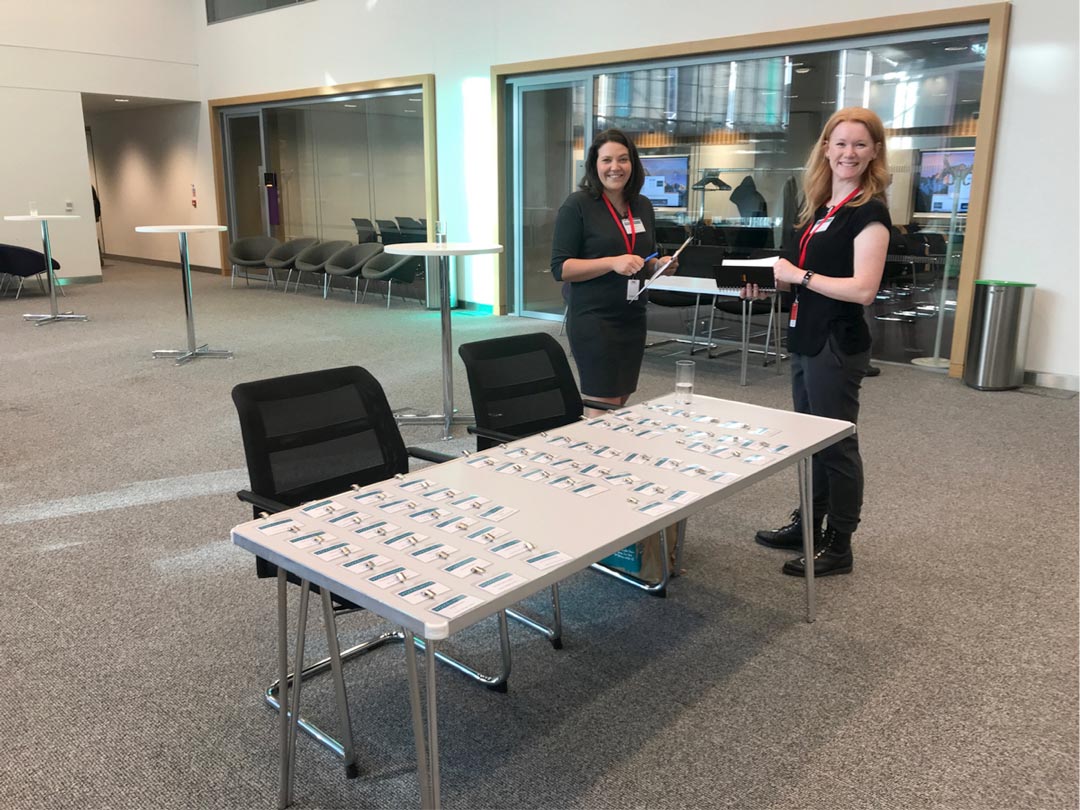
There was a good mixture of juniors and seniors, PhD students, post-docs and PI’s, and plenty of time was spent networking and chatting over coffees and finger food provided by the excellent Crick catering team. A drinks reception on Monday undoubtedly facilitated the socialising further! All in all, we hope that the collegial atmosphere sparked off many future relationships and collaborations.
Lectures & Slidepacks
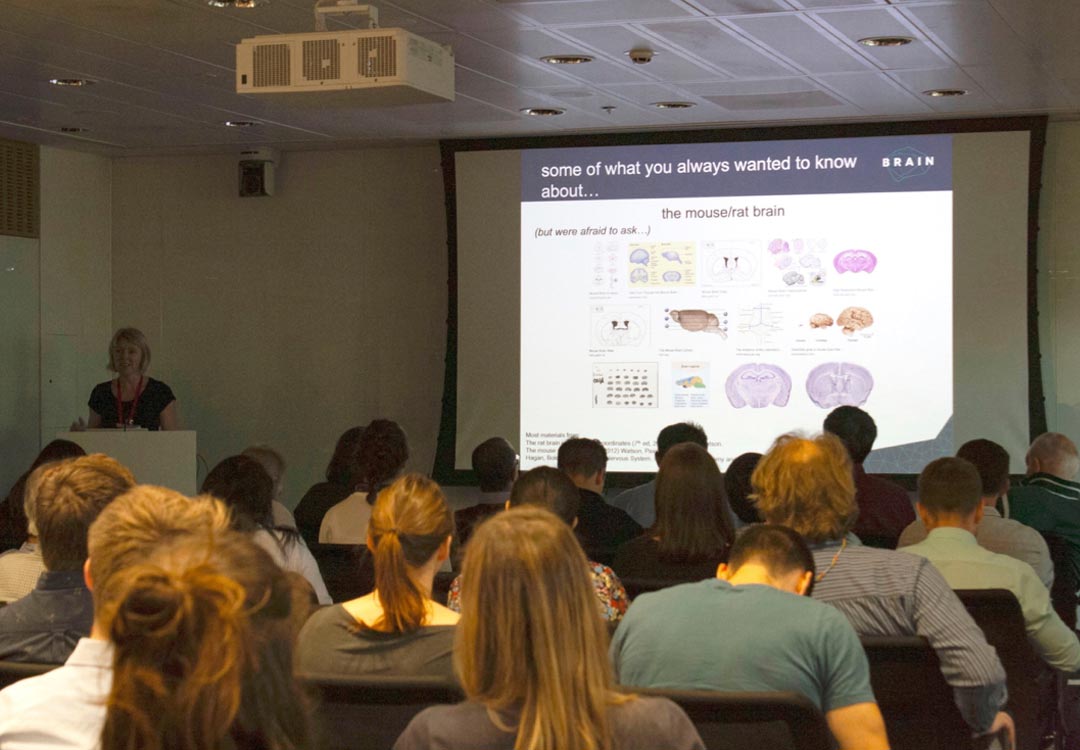
The event begun with some introductory remarks from Diana Cash (KCL), who also gave the first lecture – a primer on rodent brain anatomy. The lecture was directed at those who are new to brain anatomy in general, for example those with IT, image analysis or physics background, or those who are new to rodent brain, having perhaps spent time analysing human ones.
[Due to copyright restrictions on some images used in this lecture, we regret that it is not possible to publicly share the slides; email us to ask for your own private copy]

Following on the anatomy theme, Eugene Kim (KCL) provided an excellent overview of available rodent brain templates and atlases suitable for use in MRI analyses. We are also posting links to rodent brain templates/atlases in the section below (templates and atlases). If anyone is aware of other rodent (or other species) that should be included in this list, please email us.

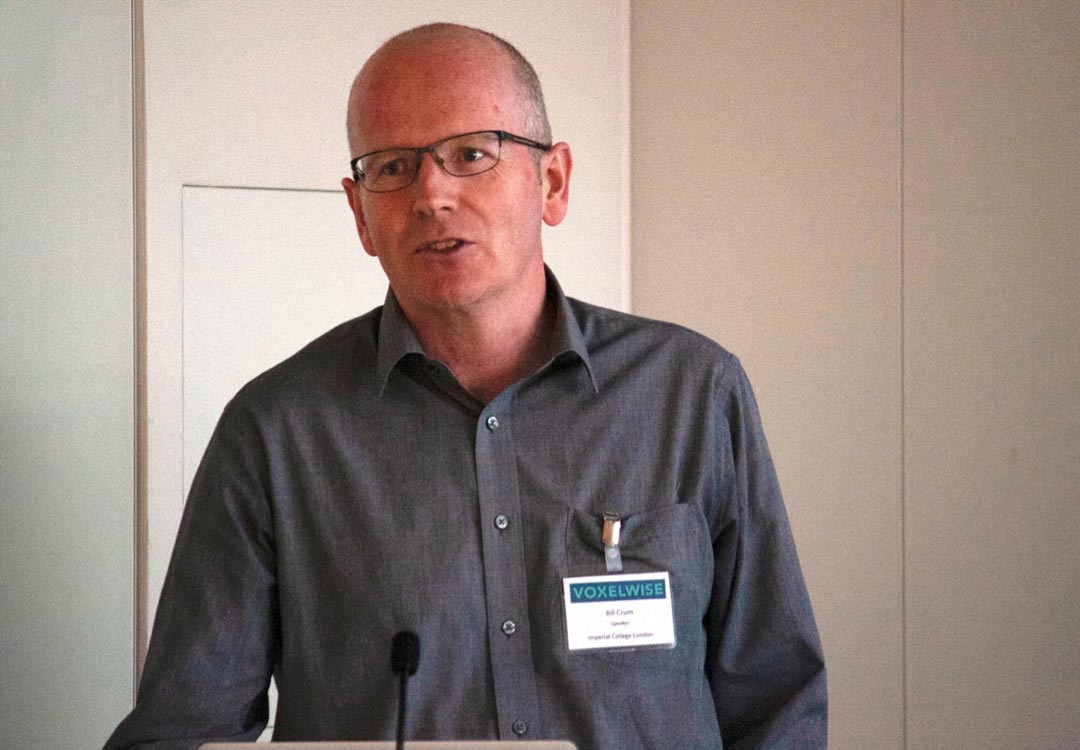
Bill Crum (Imperial) gave an informative and educational and overview of image registration in preclinical neuroimaging, with some important take home messages: that registration is vitally important, but difficult and not a push-button solution, also not a substitute for quality imaging – critically, we must ensure to image our subjects well positioned and not rely on registration to “straighten them out” afterwards! Bill’s lecture slides can be found here.
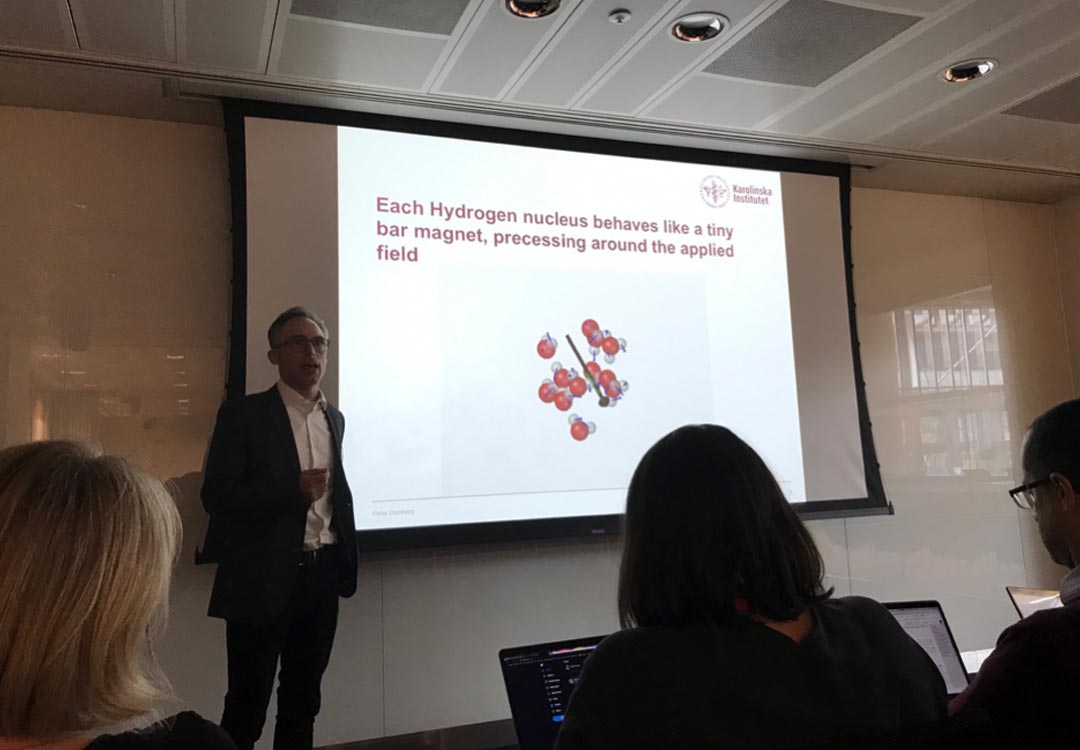
Peter Damberg (Karolinska, Stockholm) reminded us of the main principles of MR physics with an angle on imaging rodents using high field scanners.
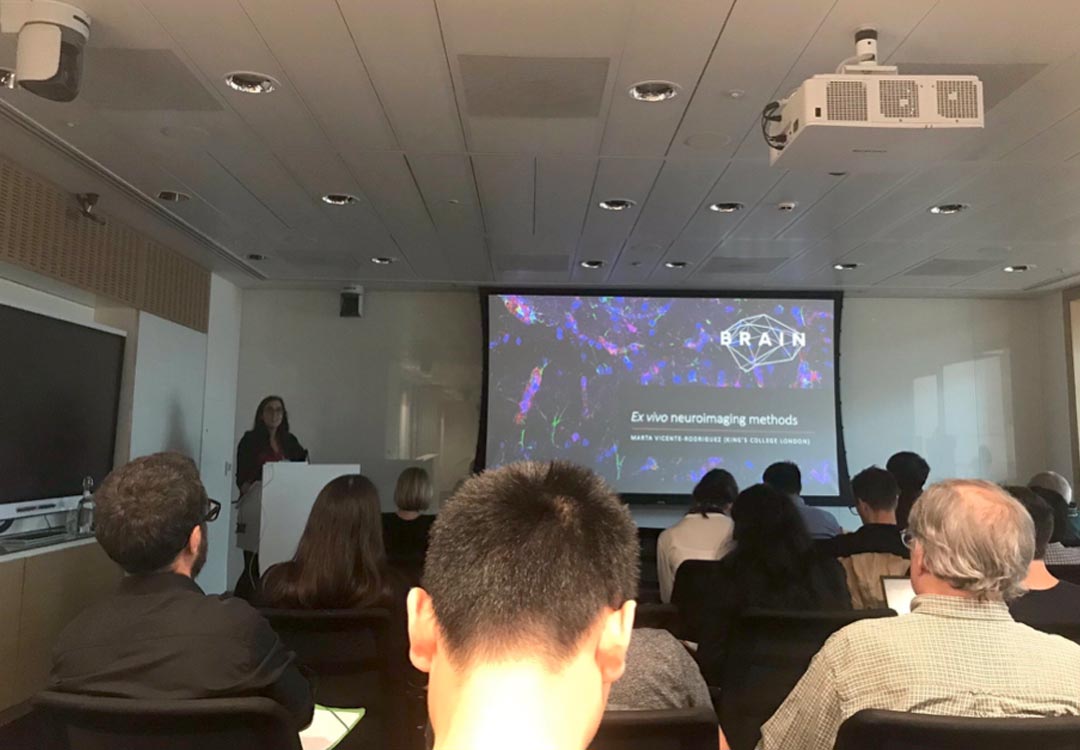
Marta Vicente-Rodriguez (KCL) reminded us that it is not all MRI, and that corroborative (preclinical) post mortemmethods such as autoradiography, histology and RNAscope are also neuroimaging.
Marta’s beautifully colourful lecture on Ex vivo neuroimaging methods can be found here.
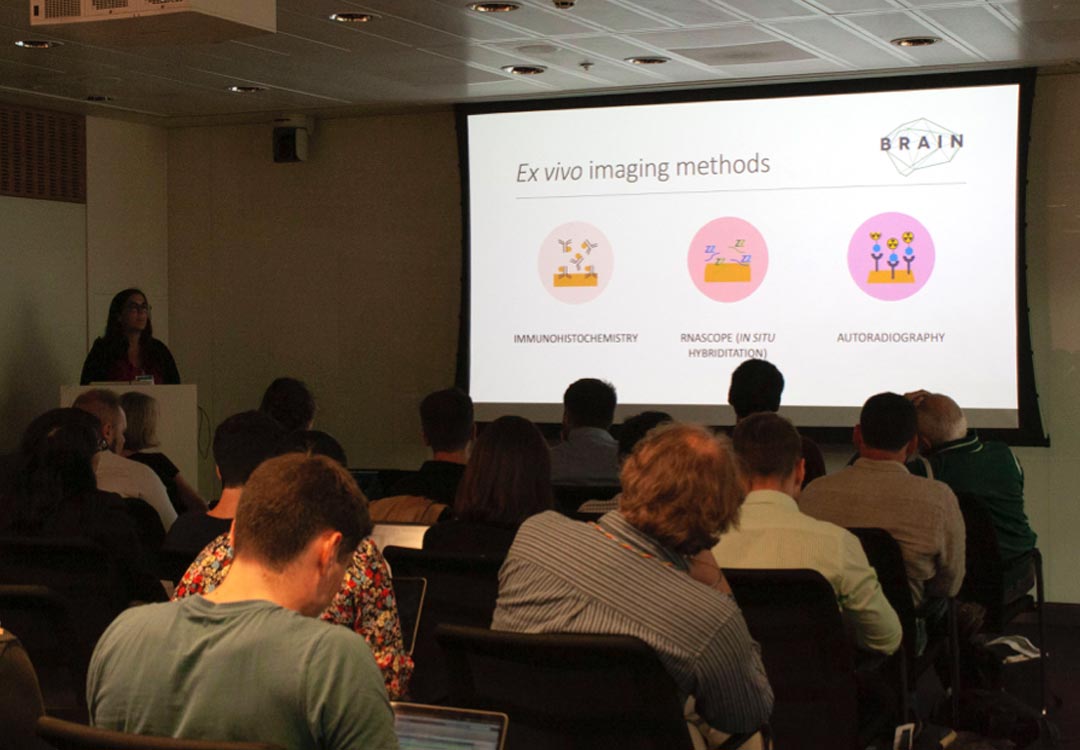
If anyone is interested to learn more about stereology-related method for counting cells using a combination of our in-house Brain Chopper software, with STEPanizer tool, as shown in Marta’s slides, please email us.
More info about the STEPanizer tool in this paper.
After lunch, there was another intensely MRI-based session.
Stephen Sawiak (University of Cambridge) went through his SPM-based toolbox for mouse brain image analysis, SPMMouse, showing how it can be used to analyse not only mouse brains, but other species such as rats, marmosets, and even sheep. Stephen drove the message of image registration in analysis further, stressing the importance of checking the quality of pre-processing before statistically comparing groups of images (aka making blobs J)
If you would like to obtain a newer version of SPMMouse (for SPM12), or indeed to use SPMMouse with other species that Stephen mentioned, get in touch with him directly via his website.
Next we had an impressive presentation by Jason Lerch (University of Oxford) who carried on the theme of structural image analysis, giving examples of longitudinal studies and analyses, using software and pipelines developed during his prolific time at the Mouse Imaging Centre, Hospital for Sick Children, in Toronto, Canada. All this is documented in Jason’s talk “Processing and analysis of longitudinal data”, and also available freely from https://github.com/Mouse-Imaging-Centre.
Back to Eugene Kim (KCL) who, in his second lecture of the day showed assorted examples of methods used at the Brain centre for image registration and analysis, EPI distortion correction tricks that work on the Bruker scanner (in Paravision 6) and how to analyse mouse resting state fMRI (the type later presented by Joanes Grandjean).
To learn more about distortion correction please see Eugene’s distortion correction tutorial (slides 7-14) and download example data from here.
Taking the imaging principles to another realm, Jorge Cardoso (KCL) showcased examples of using AI in Healthcare and Neuroradiology, the main principles of which can also be applied to the preclinical data.

Yohan Yee (Mouse Imaging Centre, Toronto) gave some amazing examples of connecting structural MRI data to the Allen Brain Atlas (ABA) utilising the freely publicly available data on regional gene expression and neural connections mapping from the Allen Brain Institute. See more from Yohan at his Github page; his Voxelwise presentation is here.

Carrying on the theme of connecting to the ABA, Konstantinos “Dinos” Meletis (Karolinska, Stockholm) introduced his group’s work on establishing a molecular atlas of the mouse brain using a novel method of spatial transcriptomics – more info at The Meletis laboratory home page.
The scientific part of the day finished with Eilidh MacNicol, a PhD student at KCL, who reminded us all of the importance of suitable data visualization, particularly for studies involving imaging. Eilidh gave examples of how to show the full effectinstead of just thresholded “blobs”, when overlaying MRI statistical results onto a brain template (dual coding method), of displaying results or regions of interest in 3D, and of connectograms to illustrate inter-regional brain connectivity. Example data and more info on dual coding, 3D display, as well as fMRI analysis of rat somatosensory forepaw stimulation with SPM12 can be downloaded from here.

We finished the day with a very welcome networking reception with excellent array of drinks and finger food from The Crick’s hospitality team.
On Tuesday, we started Mark Horsfield (Xinapse Systems) who introduced his commercial software called JIM, which can be used for both data visualisation and processing, with capability to read raw data from Bruker scanners, as well dicom and nifti file formats – all commonly used by the preclinical neuroimaging community. Mark was on hand for the rest of the day to demo JIM to interesting parties; the software can be downloaded and fully tried for free for 30 days.

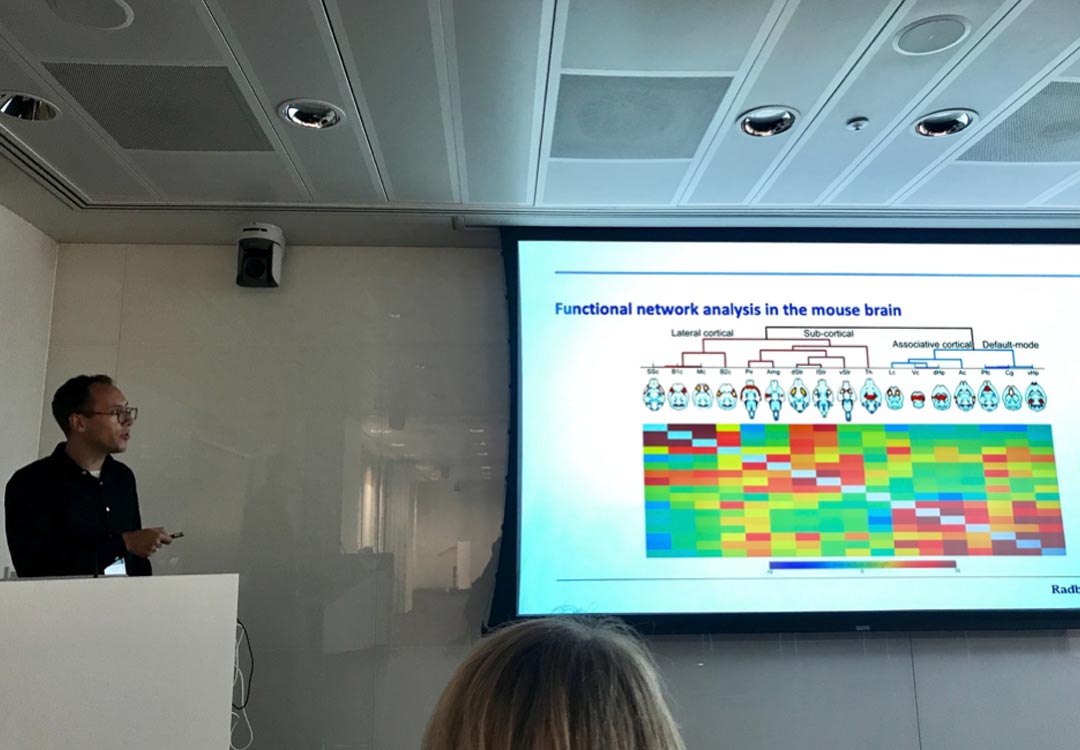
The session ramped up to fMRI: Joanes Grandjean (Radboud, Nijmegen) talked about his extensive experience of resting state fMRI in the mouse brain and the utility in brain disorders. Just how challenging this methodology is, is revealed by an impressive multi-centre collaborative paper in which Joanes et al. compared data sets from 17 international labs, recommending how to improve signal and avoid confounds. He also urged everyone to share data and adopt BIDS structure to facilitate comparisons.
Daniel Gutierrez (Italian Institute of Technology) continued the fMRI theme by outlining a new way to analyse resting state fMRI timeseries dynamically, by looking at the so-called co-activation patterns (CAPS) which can reveal different functional states of the brain. Further information on this methodology can be found here.

We next heard from Andreas Hess (Erlangen-Nürnberg) who talked about translational fMRI from rodents to humans, with emphasis on anaesthesia, BOLD responses and pain processing in the brain. Andreas also showed a software MagnAn which he developed in collaboration with BioCom, and which can be obtained by emailing support@biocom-online.de (more info here).

This interesting session finished with Artem Shatillo from Charles River Laboratories. Artem showed a truly eye-opening industry perspective on preclinical neuroimaging and highlighted the many challenges of successfully combining client-led research and high throughput with the often sophisticated, complex and varied aspects of rodent brain imaging with MRI and other modalities.
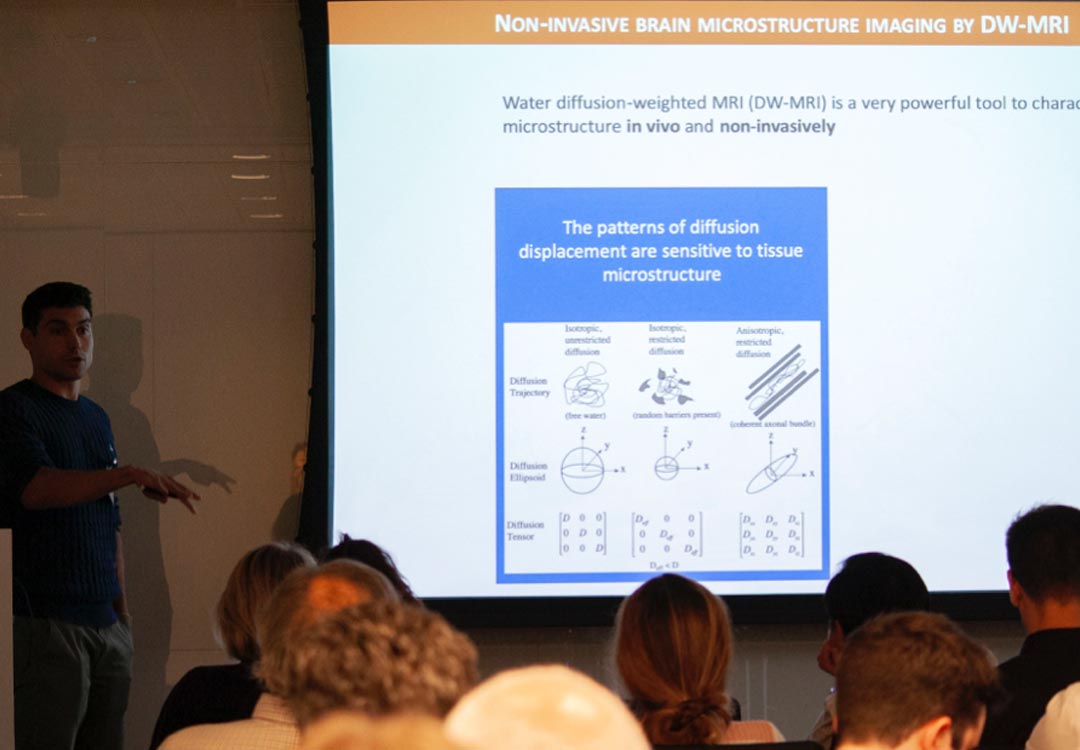
The final session of the workshop consisted of four lectures on different aspects of diffusion MRI. Bernard Siow (Crick) started off by explaining and reminding us of the main principles of diffusion MRI.
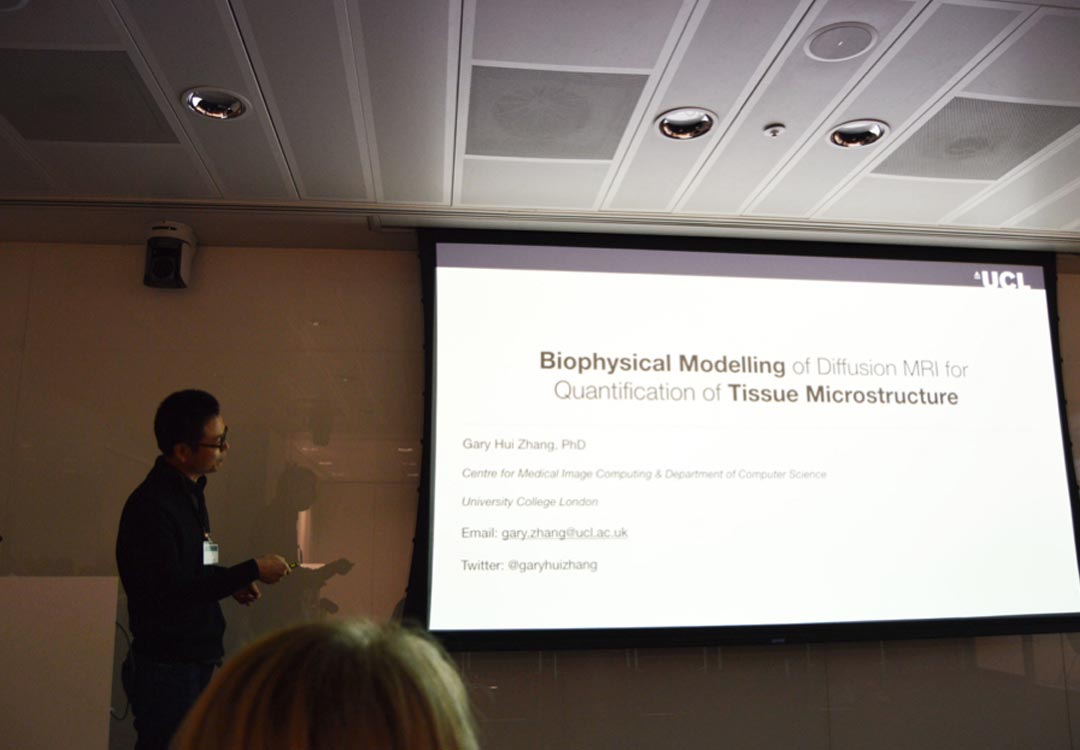
This was followed by Gary Zhang (UCL) who gave more detail on diffusion MRI and various types of biophysical modelling such as for example NODDI (neurite orientation, dispersion and density index) that he and colleagues developed to get a better handle on estimating microstructural complexity of axons and dendrites in the brain tissue. (see more info here)
Flavio Dell’Acqua (KCL) demonstrated some amazingly detailed tractography in both human and animal brains, with practical tips on improved sample preparation for high resolution ex vivoMR imaging.

Final speaker was Marco Palombo (UCL) who introduced the novel method of diffusion MRS which allows characterizations of tissues such as brain in vivo, by quantifying the diffusion properties of MR-observable metabolites, instead of the commonly used water (e.g. in diffusion MRI). A handy review on the subject can be found in preprint here.
We finished on time and dissipated, tired but with high hopes of new collaborations and harmonisations of protocols in the near future in preclinical neuroimaging community.
More Pictures


Additional Voxelwise Materials
Software List
Analysis of Functional NeuroImages (AFNI)
Unix-based software suite for the analysis and display of anatomical and functional MRI
Advanced Normalisation Tools (ANTs)
A collection of tools for image registration and template generation
Circlize
R package for circular graphs, based on the PERL programme Circos
https://github.com/jokergoo/circlize
https://doi.org/10.1093/bioinformatics/btu393
dicm2nii
Matlab toolbox that allows conversion of dicom and nifti files into matrices, which can then be used to convert spmT maps to p-values
https://github.com/xiangruili/dicm2nii
ITKSnap
Software for 3D visualisation of medical images. Used to transform nifti images to VTK for glass brain examples.
http://www.itksnap.org/pmwiki/pmwiki.php
FMRIB Software Library (FSL)
A comprehensive library of neuroimaging analysis tools via command line and GUI. Includes eddy current (eddy) and spin-echo susceptibility distortion correction (topup), fitting DTI metrics (dtifit), and visualisation (fsleyes)
https://fsl.fmrib.ox.ac.uk/fsl/fslwiki
Jim 8 by Xinapse Systems
Image visualisation and processing software.
http://www.xinapse.com/j-im-8-software/
MagnAn
Facilitates manual and automatic applications of complex analysis strategies for temporal and spatial MRI data including fully flexible ROI/atlas based analysis and, uniquely, seamless integration of sophisticated graph theoretical analyses. Due to its high flexibility and intuitive GUI it easily works across species from mouse to human.
For more info contact: support@biocom-online.de
MARSeille Boîte À Région d’Intérêt (MarsBaR)
SPM toolbox for ROI analysis http://marsbar.sourceforge.net/
MINC
R package and Virtual Machine designed to read and write MINC volumes and perform voxelwise statistical routines. mincVM requires Virtual Box emulator.
http://mouse-imaging-centre.github.io/RMINC/ – Website
https://www.virtualbox.org/ – Emulator
Nanslice
Python package which is an alternative to FSLeyes and also produces dual- coded results images (nanslicer).
https://github.com/spinicist/nanslice
http://dx.doi.org/10.1016/j.neuron.2012.05.001
Paraview
Software for visualisation and animation of 3D VTK images.
Quantitative Imaging Tools (QUIT)
Collection of C++ programs, containing qiaffine, for scaling and rotating images
https://github.com/spinicist/QUIT
https://doi.org/10.21105/joss.00656
Rapid Automatic Tissue Segmentation (RATS)
Linux-based pre-clinical masking software
https://www.iibi.uiowa.edu/rats-rodent-brain-mri
https://doi.org/10.1016/j.jneumeth.2013.09.021
Statistical Parametric Mapping (SPM12)
Matlab-based software suite used for generating voxelwise statistical models
https://www.fil.ion.ucl.ac.uk/spm/software/spm12/
SPMmouse
Tidygraph & ggraph
R packages for tidyverse-compatible network analysis
https://cran.r-project.org/web/packages/tidygraph/index.html https://cran.r-project.org/web/packages/ggraph/index.html
Demos and Example Datasets
Mouse Resting State fMRI Analysis
Joanes Grandjean and Eugene Kim demonstrated the analysis of mouse resting fMRI data during a breakout session. To try it for yourself you will need to download example data, templates, scripts and software listed below.
Download example data, template and scripts from here:
[data acquired in collaboration between Singapore Bioimaging Consortium and King’s College London by Joanes Grandjean and Eugene Kim]
Software required:
FSL, AFNI, ANTS (see above)
and either
RATS_MM (for Linux) https://www.iibi.uiowa.edu/rats-rodent-brain-mri
or
QUIT (for Mac or Linux) https://github.com/spinicist/QUIT
Forepaw Stimulation fMRI Analysis (rat)
Eilidh MacNicol demonstrated how to analyse rat fMRI, using SPM12.
Download example data & rat brain template from here
Software required: Matlab and SPM12
Data Visualisation Using Dual Coding Approach
Eilidh MacNicol demonstrated how to create dual-coded figures as an alternative to thresholding approach, during a breakout session.
Reference: Allen et al (2012) Data Visualization in the Neurosciences: Overcoming the Curse of Dimensionality. Neuron 74:603–608.
Download scripts, templates and examples from here.
Software required: Matlab and Python
3D MRI Data Visualisation (“The Glass Brain”)
Eilidh MacNicol demonstrated how to create a 3D visualisation of ‘blobs’ and an ‘ROI’ using an approach recommended by https://f1000research.com/articles/4-466/v1
Downloads here
Software required:
ITKsnap, Paraview (see above)
More info about the modified rat brain template we use for the Glass brain, fMRI analysis and Dual- coding visualisation demos can be found here:
https://scalablebrainatlas.incf.org/rat/VSNetal11
Data Distortion Correction
Eugene Kim demonstrated data distortion correction.
Downloads here
Useful (methods-y) Publications from Voxelwise Speakers and Their Labs
Alexander DC, Dyrby TB, Nilsson M, Zhang H (2018) Imaging brain microstructure with diffusion MRI: practicality and applications. NMR Biomed 32:e3841–26. doi: 10.1002/nbm.3841
Crum WR, Giampietro VP, Smith EJ, et al (2013a) A comparison of automated anatomical-behavioural mapping methods in a rodent model of stroke. Journal of Neuroscience Methods 218:170–183. doi: 10.1016/j.jneumeth.2013.05.009
Crum WR, Modo M, Vernon AC, et al (2013b) Registration of challenging pre-clinical brain images. Journal of Neuroscience Methods 216:62–77. doi: 10.1016/j.jneumeth.2013.03.015
Dorr AE, Lerch JP, Spring S, et al (2008) High resolution three-dimensional brain atlas using an average magnetic resonance image of 40 adult C57Bl/6J mice. NeuroImage 42:60–69. doi: 10.1016/j.neuroimage.2008.03.037
Fernandes DJ, Ellegood J, Askalan R, et al (2017) Spatial gene expression analysis of neuroanatomical differences in mouse models. NeuroImage 163:220–230. doi: 10.1016/j.neuroimage.2017.08.065
Fürth D, Vaissière T, Tzortzi O, et al (2017) An interactive framework for whole-brain maps at cellular resolution. Nat Neurosci 21:139–149. doi: 10.1038/s41593-017-0027-7
Ganglberger F, Kaczanowska J, Penninger JM, et al (2018) Predicting functional neuroanatomical maps from fusing brain networks with genetic information. NeuroImage 170:113–120. doi: 10.1016/j.neuroimage.2017.08.070
Grandjean J, Canella C, Anckaerts C, et al (2020) Common functional networks in the mouse brain revealed by multi-centre resting-state fMRI analysis. NeuroImage 205:116278–11. doi: 10.1016/j.neuroimage.2019.116278
Gutierrez-Barragan D, Basson MA, Panzeri S, Gozzi A (2019) Infraslow State Fluctuations Govern Spontaneous fMRI Network Dynamics. Current Biology 29:2295–2306.e5. doi: 10.1016/j.cub.2019.06.017
Lerch JP, van der Kouwe AJW, Raznahan A, et al (2017) Studying neuroanatomy using MRI. Nat Neurosci 20:314–326. doi: 10.1038/nn.4501
Ligneul C, Palombo M, Hernández-Garzón E, et al (2019) Diffusion-weighted magnetic resonance spectroscopy enables cell-specific monitoring of astrocyte reactivity in vivo. NeuroImage 191:457–469. doi: 10.1016/j.neuroimage.2019.02.046
Ortiz C, Navarro JF, Jurek A, et al (2019) Molecular Atlas of the Adult Mouse Brain. 50:154–25. doi: 10.1101/784181
Palombo M, Shemesh N, Ronen I, Valette J (2018) Insights into brain microstructure from in vivo DW-MRS. NeuroImage 182:97–116. doi: 10.1016/j.neuroimage.2017.11.028
Stille M, Smith EJ, Crum WR, Modo M (2013) Journal of Neuroscience Methods. Journal of Neuroscience Methods 219:27–40. doi: 10.1016/j.jneumeth.2013.06.003
Sawiak SJ, Wood NI, Williams GB, et al (2013) Voxel-based morphometry with templates and validation in a mouse model of Huntington’s disease. Magnetic Resonance Imaging 31:1522–1531. doi: 10.1016/j.mri.2013.06.001
Sawiak SJ, Shiba Y, Oikonomidis L, et al (2018) Trajectories and Milestones of Cortical and Subcortical Development of the Marmoset Brain From Infancy to Adulthood. Cerebral Cortex 28:4440–4453. doi: 10.1093/cercor/bhy256
Van Eede MC, Scholz J, Chakravarty MM, et al (2013) Mapping registration sensitivity in MR mouse brain images. NeuroImage 82:1–11. doi: 10.1016/j.neuroimage.2013.06.004
Valdés-Hernández PA, Sumiyoshi A, Nonaka H, et al (2011) An in vivo MRI Template Set for Morphometry, Tissue Segmentation, and fMRI Localization in Rats. Front Neuroinform 5:26. doi: 10.3389/fninf.2011.00026
Yee Y, Fernandes DJ, French L, et al (2018) Structural covariance of brain region volumes is associated with both structural connectivity and transcriptomic similarity. NeuroImage 179:357–372. doi: 10.1016/j.neuroimage.2018.05.028

This work is licensed under a Creative Commons Attribution-NonCommercial-ShareAlike 4.0 International License.
Sponsors